Product
emd-cloud
Every asset, one login
The platform where devices are provisioned, configured, updated and monitored — with CAN logging, customisable dashboards, edge rules, a GraphQL API and client-owned DBC decoding.
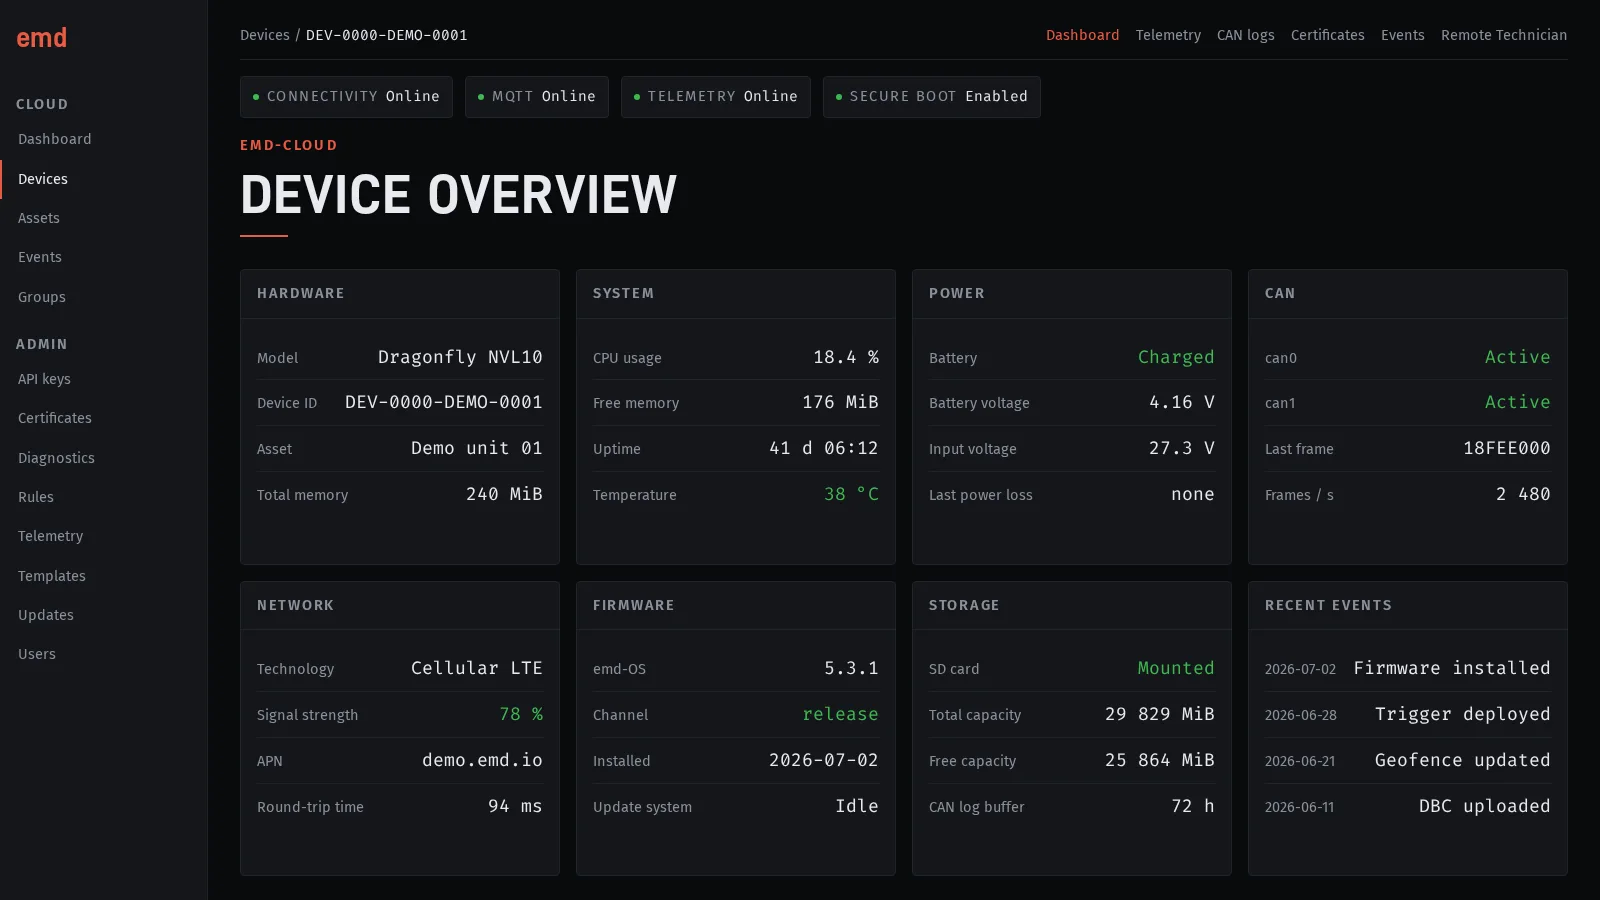
emd-cloud is the single place where every connected asset is provisioned, configured, updated and watched — whatever it is and wherever it works.
Three of the modules that run on top of it have pages of their own: Remote Technician, for live CAN in the browser; CanGuard, for continuous recording and fault triggers; and Warp, for OEM diagnostic software over a virtual RP1210 interface.
Asset management
Devices are provisioned, updated and monitored in a single click. Each unit reports its connectivity, battery, bus state, signal strength, CPU and memory, alongside the firmware version it is running — and updates go out to one device or to a whole batch. Configuration covers APN, Wi-Fi, Ethernet, CAN and Modbus.
Dashboards
Dashboards are built on Grafana and fully customisable, so each operation gets the views it actually needs rather than a fixed set. CAN telemetry, GPS, GPIO and the rest of the device’s inputs combine in the same panel.
Events and alerts
A real-time view covers the predefined events — alarms, status changes, critical notifications — next to the events each client defines from eFlow.
eFlow edge computing
eFlow is a rule engine that runs on the device itself. Triggers, operations and outputs combine from the interface into business logic that executes where the data is produced, and it integrates TensorFlow Lite so a model can run inference locally.
GraphQL API
A GraphQL API puts device data straight into the client’s own systems, with queries that return exactly the fields required and nothing else.
Custom DBC decoding
emd-dact, the acquisition module, accepts DBC tables supplied by the client for decoding CAN parameters. Proprietary definitions stay under the client’s control.